Zonal statistics in R
Zonal statistics is a useful tool that allows you to determine arbitrary statistics from raster pixels that intersect with, for example, a polygon from a vector layer. Most of the time, we have a default selection of several statistics in the software GIS such as maximum, average, minimum value, and so on. But what if we want to calculate a statistic that we have invented? In the software GIS it is not impossible, but it requires a lot of work , e.g. Modeler. Luckily we have R, where you can do it in a function:) Anyway, let’s start with simple things. We start the raster library, where there is the extract function, which can be used to extract the values of the raster pixels that are in the given vector:
install.packages(‘raster’)
library(raster)
We initialize the rgdal library, which we will use to load vector data:
library(rgdal)Wczytujemy plik rastrowy oraz plik z warstwą wektorową np. z darmowych warstw udostępnianych przez CODGiK (w moim przypadku NMT i warstwa powiatów województwa mazowieckiego):
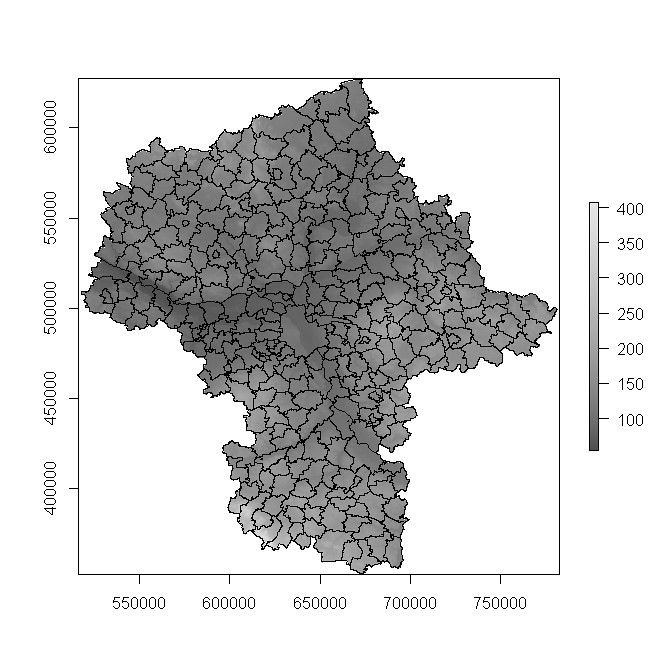
We load a raster file and a file with a vector layer, e.g. from the free layers (in our case, DEM and a layer with districts from Mazowieckie Voivodeship):
r = raster(“C:/grid_mazowieckie.tif”)

districts = readOGR(“C:/”,”districts_maz”)
The loaded layers look like this:
Using the extract function from the raster library, we can extract the DEM cell values that are within the first two districts, for example:
h = extract(r,districts[1:2,])The variable h generated is a list containing the elevation values for a given district in its individual elements. We call these values with:
h[[1]]

[1] 98.47 98.97 99.38 99.85 99.68 99.31
For example, if we want to count the average height value for a given district, we need to add the attribute fun = mean to the extraction function:
h_mean = extract(r,districts[1:2,],fun=mean)When we call the variable h_mean in the console, we see that it is already an array of values:
h_mean
         [,1]
[1,] 119.7398
[2,] 119.0318
We can add any function we create as an attribute fun to the extract function. Recall that for each district we need to get a vector of values and process it. Let’s define a function that creates a statistic that returns us the percentage of pixels with values greater than the average height in the district. First, we create the function our_function that contains only a local variable x, which is our set of pixel values, and a logical argument na.rm, which is responsible for removing the values from NA:
our_function function(x,na.rm=TRUE)

{
Let’s add a variable to the function that contains the mean value
avg = mean(x)Let’s count how many pixels there are in total:
all = length(x)and count how many are larger than avg:
more_than_avg = sum(x › avg)Let’s count the percentage:
prc = (more_than_avg/all)*100The function returns the percentage:
return(prc)We close the function definition:
}Our function should eventually look like this:
our_function function(x,na.rm=TRUE)

{

avg = mean(x)

all = length(x)

more_than_avg = sum(x›avg)

prc = (more_than_avg/all)*100

return(prc)

}
To get the percentage value, we add it to the fun attribute in the extract function:
pix_prc = extract(r,districts[1:2,],fun=our_function)The result is an array containing the percentage values from the function we defined:
prc_pixeli

         [,1]
[1,] 46.52973
[2,] 38.13020
We can modify the extract function depending on what data we want to get. We recommend having a look at the technical documentation of this function, or at the help:
help(“extract”)